Sports
Using Linear Regression to Model Point Spreads in College Basketball – Towards Data Science

Sign up
Sign in
Sign up
Sign in
Josh Yazman
Follow
Towards Data Science
—
1
Listen
Share
It stands to reason that the easiest way to predict who will win a college basketball game is to predict who will score more points. Predicted point spreads from Vegas bookkeepers can be highly predictive of win probability, but sometimes point spreads are not available, like when you’re putting together your bracket for the tournament and trying to predict the outcomes of second, third, and fourth round games. For those situations, this post describes three attempts to predict score spread:
The models are built and tested using game log data for 351 Division 1 teams downloaded from sports-reference.com. Training data consists of game logs from 2014–2017 and models are tested on 2017–18 game logs.
The first model attempted is a linear model using predictors selected from a combination of domain expertise and exploratory analysis. All data considered here are spreads — the difference between the number of some event (like blocked shots) for one team vs. another. To say tov.spread = 5 means a team had five more turnovers than their opponent.
One handy exploratory tool is the GGally::ggpairs() plotting tool. It produces a matrtix of plots that display the relationship between each pair of variables in a data set as well as their correlations and distributions. The bottom row if this visual shows the interactions of different variables with point spread.
Focusing on the bottom row of plots, which shows the linear relationships between various performance metrics and the point spread, field goal percentage, three point percentage, assists, defensive rebounds, and turnovers appear to have strong relationships with point spread.
A linear model using those variables is a good start! Adjusted R-squared of 0.901 means we’ve explained 90% of the variance in the data. The residuals — the difference between individual predictors and their actual values — appears to be centered on zero, which is good. But error rates are higher when point spreads are most extreme, which suggests possible room for improvement.
Maybe a more algorithmic approach will yield a better model!
One such algorithmic approach is linear modeling with bi-directional stepwise variable selection — a method that iteratively tests combinations of predictor variables and selects the model that minimizes AIC. At each iteration, new variables are added to a model, the model is tested, and variables are dropped if they fail to improve fit (ISLR).
The optimal model selected with this method includes ten variables. This time we include spreads, but also include the number of three pointers and free throws for and against and the offensive rebound spread.
This model was much better! It explains 95.5% of the variance in point spreads. Field goal percentage spread is still the strongest predictor in the model, but inclusion of additional variables was clearly helpful.
Our residuals still have heavy tailed distributions — in other words out predictions are still less accurate when spreads are very high or very low.
Each of the models we’ve attempted so far are “greedy” in the sense that predictor variables are included or not included with no grey area. The final model attempted takes a different approach.
Least Angle Regression (LAR) is also an iterative predictor selection method, but instead of binary decisions to include or exclude a variable, variables are included to the extent they help improve model fit.
A model is initiated using the variable with the highest correlation with the target. Then the coefficient for the predictor variable is adjusted until another variable has a higher correlation than it does, at which point the first coefficient is locked into the motions of the next coefficient. The process is repeated until the optimal model is found. Variables can be excluded from the model if their coefficients are shrunk to zero, but the process allows for much more nuance in that decision (ESLR).
The variables and coefficients produced by LAR look more similar to the Heuristic than the Bi-Directional Stepwise approach — focusing more on spread variables (team A had 5 more turnovers than team B) as opposed to count variables (team A had 15 turnovers and team B had 10).
As for model fit, LAR fits right between the other two approaches. The model explains 92% of the variance in the data.
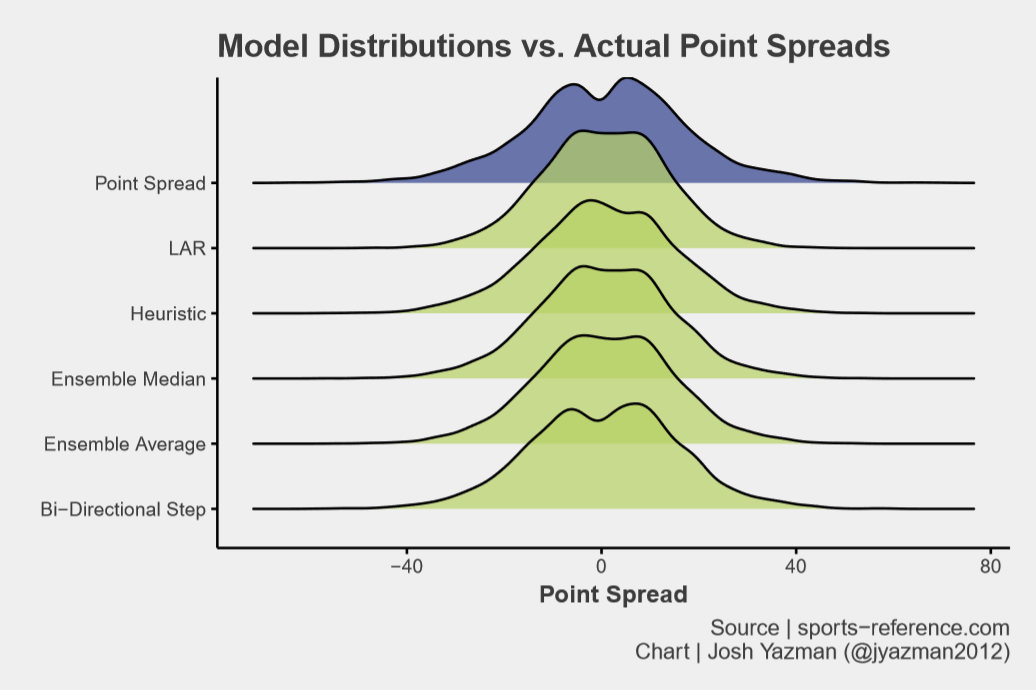
The test data consists of 2017–2018 game logs¹ covering 3,316 games. Our three models are evaluated on the distribution of error terms as well as Mean Absolute Error (MAE). In addition to the three models fit above, two additional ensemble predictions are tested:
None of the models perfectly mirror the distribution of actual scores particularly at the extreme ends. But that said, Bi-Directional Stepwise looks pretty good! There’s an appropriate dip near zero and heavy tails that trace the rough outlines of the actual point spread distribution.
Bi-Directional Stepwise regression also minimizes MAE followed by the Ensemble Average and Median models.
The Bi-Directional Stepwise model demonstrates out of sample accuracy and explains the most variance in the data. This is clearly the best model out of the bunch for predicting point spread.
Next, I plan to use the point spread as an input into a classification model to predict win likelihoods by team.
¹ Game logs in the test set were downloaded on January 27th 2018
Code and data can be found here: github.
—
—
1
Towards Data Science
Data Analyst specializing in surveys & RCTs, instructor @General Assembly, advocate @PanCAN, grad student @Northwestern Univ. Twitter: @jyazman2012
Help
Status
About
Careers
Press
Blog
Privacy
Terms
Text to speech
Teams


