Sports
Mizzou Basketball Stats, Analysis, Reaction: Study Hall vs Texas A&M – Rock M Nation

Filed under:
Feast or famine.
If at any point you’re watching a Texas A&M game and thinking to yourself something along the lines of “this is almost unwatchable basketball” then chances are things are going well for A&M. This is their goal.
Now I’m sure Buzz Williams will tell you his goal is not to make his basketball team play in unwatchable games, but that’s largely the result. A&M plays very hard, they attack the rim and glass, stand in the way to take as many charges as possible, and they shoot more free throws than anyone. It’s a good way to win games when you aren’t wildly talented. And Texas A&M isn’t wildly talented. They’re a moderately talented team who is taking advantage of a pretty mediocre year in the SEC, and in College Basketball overall, to ascend in the standings.
Now as I say that, Mizzou isn’t that much different from A&M. The Tigers aren’t wildly talented either. I think you could argue there’s one wildly talented roster in this league and it’s in Tuscaloosa. But Missouri’s system is basically to try to get extra possessions by forcing turnovers and then shoot the ball well enough to make you play catch up. But as the season wore on, and Mizzou’s previously good depth got worn down, those extra possessions became fewer and the good shooting nights farther between.
This week was a tough week.
After last Saturday’s heroics in Knoxville, Mizzou tanked in Auburn Arena and left a lot on the table last night. Losing for just the second time on a Rally For Rhyan fundraising night, the shots didn’t go in early, and despite Texas A&M giving Mizzou all sorts of opportunities to get into the game, they resisted.
Missouri took a lead with around 13 minutes to play in the 1st half, and never led again. They went into halftime down 14 and never got closer than 8 points. It was a bumpy and ugly game. It was exactly as A&M wanted.
Mizzou struggled to get the game flow into their terms. That usually happens early for them. But they missed their first 5 shots and made just 3 of their first 18 attempts. So while Texas A&M was fumbling away the ball and giving Mizzou chances to take control, they just kept missing shots. Once Sean East hit their fourth made Field Goal, Mizzou would make 15 of their next 27 attempts, which sounds good until you realize they were -5 over that span. The chance was early, but once the game was on A&Ms terms, they weren’t able to really make up any ground.
On the season: Kobe Brown 43, D’Moi Hodge 38, Sean East II 18, Nick Honor 18, Noah Carter 17, DeAndre Gholston 15, Tre Gomillion 5, Isiaih Mosley 5, Mohamed Diarra 4
This was predictable. Kobe was very good, but he was really the only guy who was stringing together good plays and made shots. When one guy accounts for 40% of the made shots, he’s probably going to lead in the GameScore.
D’Moi had 6 steals and Mo had 8 rebounds. But both were otherwise unspectacular.
Nick Honor is still in a funk, and the sooner he breaks out of it the better. Mizzou is much better when he’s knocking down kick outs. But if you look at the minutes and usage rates it’s apparent this team is holding together a bit at the seams. Kobe played 39 minutes, Gholston played 35. Both were season highs.
Gholston had a terrific game against Tennessee, but didn’t against Auburn. His usage was far higher in that game, and against A&M he almost seemed to defer a little too much. In fact Mizzou had four team turnovers, which are shot clock expirations. At least a few of those were on guys being indecisive with the ball in late clock chances. Something which is very unlike this team.
So a week of lost opportunities. I don’t know. It’s disappointing. But it’s also something we’ve been worried about for months with how this team defends. And its defense coupled with a serious lack of rebounding leaves them far too susceptible to ever be comfortable going into any game. On Tuesday Mississippi State comes to town after winning 6 of their last 7. They’re still largely the same team they were two months ago. They struggle to score, but can defend the hell out of you. They’ll be big and physical and I think this is one of those game where if Mizzou wanted to come out and hit their first 5 threes they could put some real game pressure on the Bulldogs and probably hold them off.
But if they start cold for the third game in a row, it could be a tough game to win.
Four games to go, four winnable games. Just worry about winning the next one.
True Shooting Percentage (TS%): Quite simply, this calculates a player’s shooting percentage while taking into account 2FG%, 3FG%, and FT%. The formula is Total Points / 2 * (FGA + (0.475+FTA)). The 0.475 is a Free Throw modifier. KenPomeroy and other College Basketball sites typically use 0.475, while the NBA typically uses 0.44. That’s basically what TS% is. A measure of scoring efficiency based on the number of points scored over the number of possessions in which they attempted to score, more here.
Effective Field Goal Percentage (eFG%): This is similar to TS%, but takes 3-point shooting more into account. The formula is FGM + (0.5 * 3PM) / FGA
So think of TS% as scoring efficiency, and eFG% as shooting efficiency, more here.
Expected Offensive Rebounds: Measured based upon the average rebounds a college basketball team gets on both the defensive and offensive end. This takes the overall number of missed shots (or shots available to be rebounded) and divides them by the number of offensive rebounds and compares them with the statistical average.
AdjGS: A take-off of the Game Score metric (definition here) accepted by a lot of basketball stat nerds. It takes points, assists, rebounds (offensive & defensive), steals, blocks, turnovers and fouls into account to determine an individual’s “score” for a given game. The “adjustment” in Adjusted Game Score is simply matching the total game scores to the total points scored in the game, thereby redistributing the game’s points scored to those who had the biggest impact on the game itself, instead of just how many balls a player put through a basket.
%Min: This is easy, it’s the percentage of minutes a player played which were available to them. That would be 40 minutes, or 45 if the game goes to overtime.
Usage%: This “estimates the % of team possessions a player consumes while on the floor” (via sports-reference.com/cbb). The usage of those possessions is determined via a formula using field goal and free throw attempts, offensive rebounds, assists and turnovers. The higher the number, the more prevalent a player is (good or bad) in a team’s offensive outcome.
Offensive Rating (ORtg): Similar to Adjusted game score, but this looks at how many points per possession a player would score if they were averaged over 100 possessions. This combined with Usage Rate gives you a sense of impact on the floor.
IndPoss: This is approximates how many possessions an individual is responsible for within the teams calculated possessions.
ShotRate%: This is the percentage of teams shots a player takes while on the floor.
AstRate%: Attempts to estimate the number of assists a player has on teammates made field goals when he is on the floor. The formula is basically AST / (((MinutesPlayed / (Team MP / 5)) * Team FGM) – FGM).
TORate%: Attempts to estimate the number of turnovers a player commits in their individual possessions. The formula is simple: TO / IndPoss
Floor%: Via sports-reference.com/cbb: Floor % answers the question, “When a Player uses a possession, what is the probability that his team scores at least 1 point?”. The higher the Floor%, the more frequently the team probably scores when the given player is involved.Touches/Possession: Using field goal attempts, free throw attempts, assists and turnovers, touches attempt to estimate, “the number of times a player touched the ball in an attacking position on the floor.” Take the estimated touches and divide it by the estimated number of possessions for which a player was on the court, and you get a rough idea of how many times a player touched the ball in a given possession. For point guards, you’ll see the number in the 3-4 range. For shooting guards and wings, 2-3. For an offensively limited center, 1.30. You get the idea.Anyway, using the Touches figure, we can estimate the percentage of time a player “in an attacking position” passes, shoots, turns the ball over, or gets fouled.
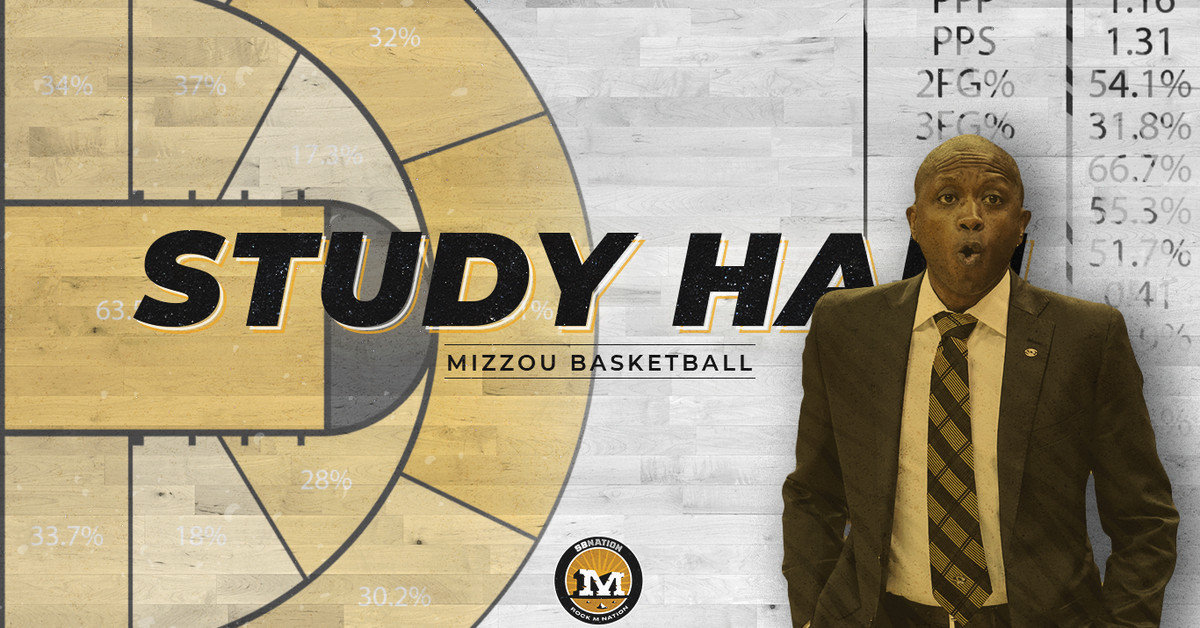
In attempting to update Study Hall, I’m moving away from Touches/Possession and moving into the Rates a little more. This is a little experimental so if there’s something you’d like to see let me know and I’ll see if there’s an easy visual way to present it.
Gambling Problem? Call (800) 327-5050 or visit gamblinghelpline.ma.org (MA), Call 877-8-HOPENY/text HOPENY (467369) (NY),
If you or someone you know has a gambling problem, crisis counseling and referral services can be accessed by calling 1-800-GAMBLER (1-800-426-2537) (CO/IL/IN/LA/MD/MI/NJ/OH/PA/TN/WV/WY), 1-800-NEXT STEP (AZ), 1-800-522-4700 (KS/NH), 888-789-7777/visit ccpg.org (CT), 1-800-BETS OFF (IA), visit OPGR.org (OR), or 1-888-532-3500 (VA).
Odds and lines subject to change. 21+ (18+ NH/WY). Physically present in AZ/CO/CT/IL/IN/IA/KS/LA (select parishes)/MA/MD/MI/NH/NJ/NY/OH/OR/PA/TN/VA/WV/WY only. Void in ONT. Eligibility restrictions apply. See terms at draftkings.com/sportsbook. On behalf of Boot Hill Casino & resort (KS).


